


Warren Buffett famously recommended that investors “be fearful when others are greedy and greedy only when others are fearful”. This is easier said than done, however – when others are fearful, it is usually for good reason. The best time to buy may well be after a prolonged sell-off when valuations are at their lowest point – yet the sell-off is often caused by some sort of crisis to which being fearful is an entirely rational response.
As an example, we now know that April 2009 was one of the all-time great buying opportunities, but the low valuations of that era did not feel too enticing while it felt like the entire financial system was on the verge of collapse.
The dream scenario, therefore, would be an asset class that was available at crisis valuations without an impending sense of doom hanging over it, but the efficient market hypothesis – which states that asset prices reflect all available information – suggests this is impossible.
Nevertheless, it is our contention the efficient market hypothesis is just that – a hypothesis. There are occasions when, not only is the market inefficient, it actually throws up opportunities that simply defy logic – and today is one such occasion.
Early redemptions
Consider this. Like any type of fixed income security, high-yield bonds need to be paid off by their final maturity date yet, unlike with investment grade debt, they are often ‘called’ or redeemed early.
If a bond trading at below par – less than 100 – is redeemed early, the holder receives its full price at par (100), which boosts their yield. As such, the ‘worst’ outcome is the bond being left outstanding until maturity rather than the holder pocketing the capital gain earlier.
There are three main reasons why high-yield bonds tend to be redeemed early:
* Bank facilities: These facilities – such as foreign-exchange processing, overdraft/revolving-credit facilities and secured loans – often have provisions or expectations around current ratios (that is, current assets divided by current liabilities). Bonds slipping into the final year of their life become current liabilities, pushing current ratios outside the bounds of what banks are comfortable with.
* Liquidity considerations: These are a key focus of ratings agencies, which regard the failure of a high-yield company to repay or refinance a bond in the final year of its life as a ‘red flag’.
* Corporate management prudence: High-yield companies are more reliant on markets being open to refinance any issues coming due. Management teams are therefore unwilling to let bonds get too close to their maturity as the market may assume the company will be ‘forced’ into issuing a bond with a higher interest rate. This happens consistently – indeed, research by Bank of America suggests the average bond called in high yield over the last 12 months was done so a little over 1.3 years ahead of its maturity. This figure has stood been between 1.1 and 1.8 years over the past decade.
Why it matters now
So why bring this up now? As the following graph shows, there are more bonds trading below 100 – meaning there is more upside to being redeemed at this cash price – than at any time in the past 25 years outside of the Global Financial Crisis or the bursting of the Dotcom Bubble.
ICE BofA Merrill Lynch Global High Yield Constrained Index price splits (% of face value)
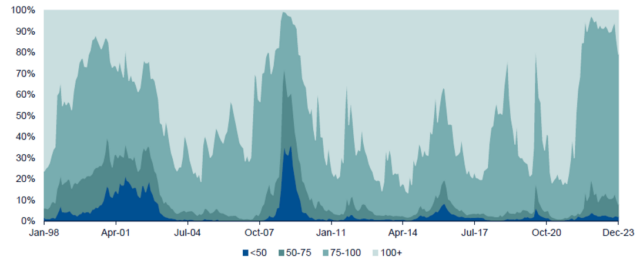
Source: ICE BofA indices as at 31/12/23
To look at it another way, the dark blue bars in the next graph show the current percentile of historic spread ranges – the difference between the yield-to-worst of these bonds and that of a US Treasury – over the past 25 years in different market segments, separated by currency and maturity.
A lower number means a tighter spread. Therefore, US high yield looks relatively expensive as it has been trading at wider spreads than today for more than 80% of the time in question. For their part, euro and sterling-denominated bonds with less than five years until maturity look better value, trading at wider spreads than today for 60% and 40% of the time in question respectively.
Spread to worst and to call one year ahead of maturity percentiles
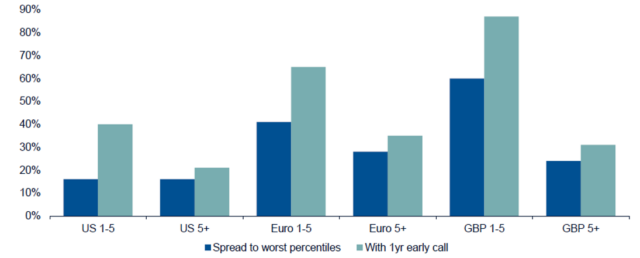
Source: ICE BofA indices from 30/06/02 31/12/23. Using the average price and maturity of each index sub-group, additional spread calculated by shortening the length of time the increase to 100 is discounted over. Percentiles are since data begins in December 1997.
Since cash prices are currently so low, however, incorporating early calls into the chart throws up very different results. As illustrated by the pale blue bars, euro and sterling-denominated one-year to five-yea high-yield bonds have wider spreads today than for 60% and 80% of the past quarter-century respectively.
Not only is this situation unusual, but it is one that will be overlooked by anyone making simple comparisons with history. And although the mispricing in this case has not necessarily been caused by “others being fearful”, we believe this is the time to be greedy.
Jack Holmes is co-manager of the Artemis Funds (Lux) – Global High Yield Bond fund